This is my tutorial on removing star halo’s caused by internal reflections using PixInsight. This came about from a forum post on CloudyNights called “Dear Alnitak, I hate you” (this tutorial is duplicated starting with post #26).
Image Credit: Shawn Harrison provide the image of Alnitak used in this tutorial
NOTE: I prefer to do tasks like this in gray-scale mode so if you have color channels it may be easier separate them before doing halo removal. This makes it so you don’t have to deal with multiple color channels at once.
Overall Steps:
– Measure the circles
– Measure the extents
– Measure the intensities
– Determine the center and radius for each circle
– Create a new image for the halo model
– Use PixelMath to re-create each circle at the measured intensities
– Subtract the model from the original image
– Clean up any remaining artifacts with CloneStamp tool
Measuring the circle extents:
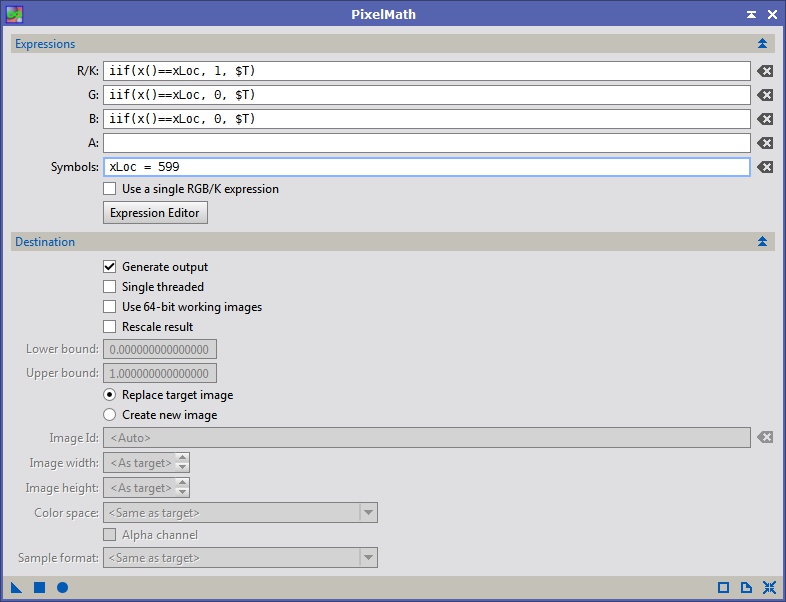
The goal here is to measure the extents of each of the circles. I use PixelMath to insert lines at different x & y locations (see Figure 1). Each line in the PixelMath form (R/K, G & B) checks to see if the current location has an x value equal to the variable xLoc (which has been assigned the value of 599). For the R/K (red channel) equation it will set the pixel value to 1 (pixels intensities range from 0 to 1 in PixInsight) for all x locations equal to 599, giving us a vertical line there. The $T variable tells PixelMath to use the value of the active window. Since the G & B (green and blue channels) get a value of 0 while R/K gets 1, the resulting line should be red. To draw the line, drag the triangle icon to the image. This applies the process to that image.
Figure 1 – Drawing a Vertical Line
Typically I hove the mouse over the image to get an approximate x/y location, then I draw a line at that location using the PixelMath operation in Figure 1 by modifying the xLoc variable. I’ve used this process with xLoc values of 599 and 1329. You can either make a copy of the original image to draw on, or just make the changes and then undo them when your measurements are complete. Figure 2 shows the lines on the image.
Figure 2 – Lines Inserted on Image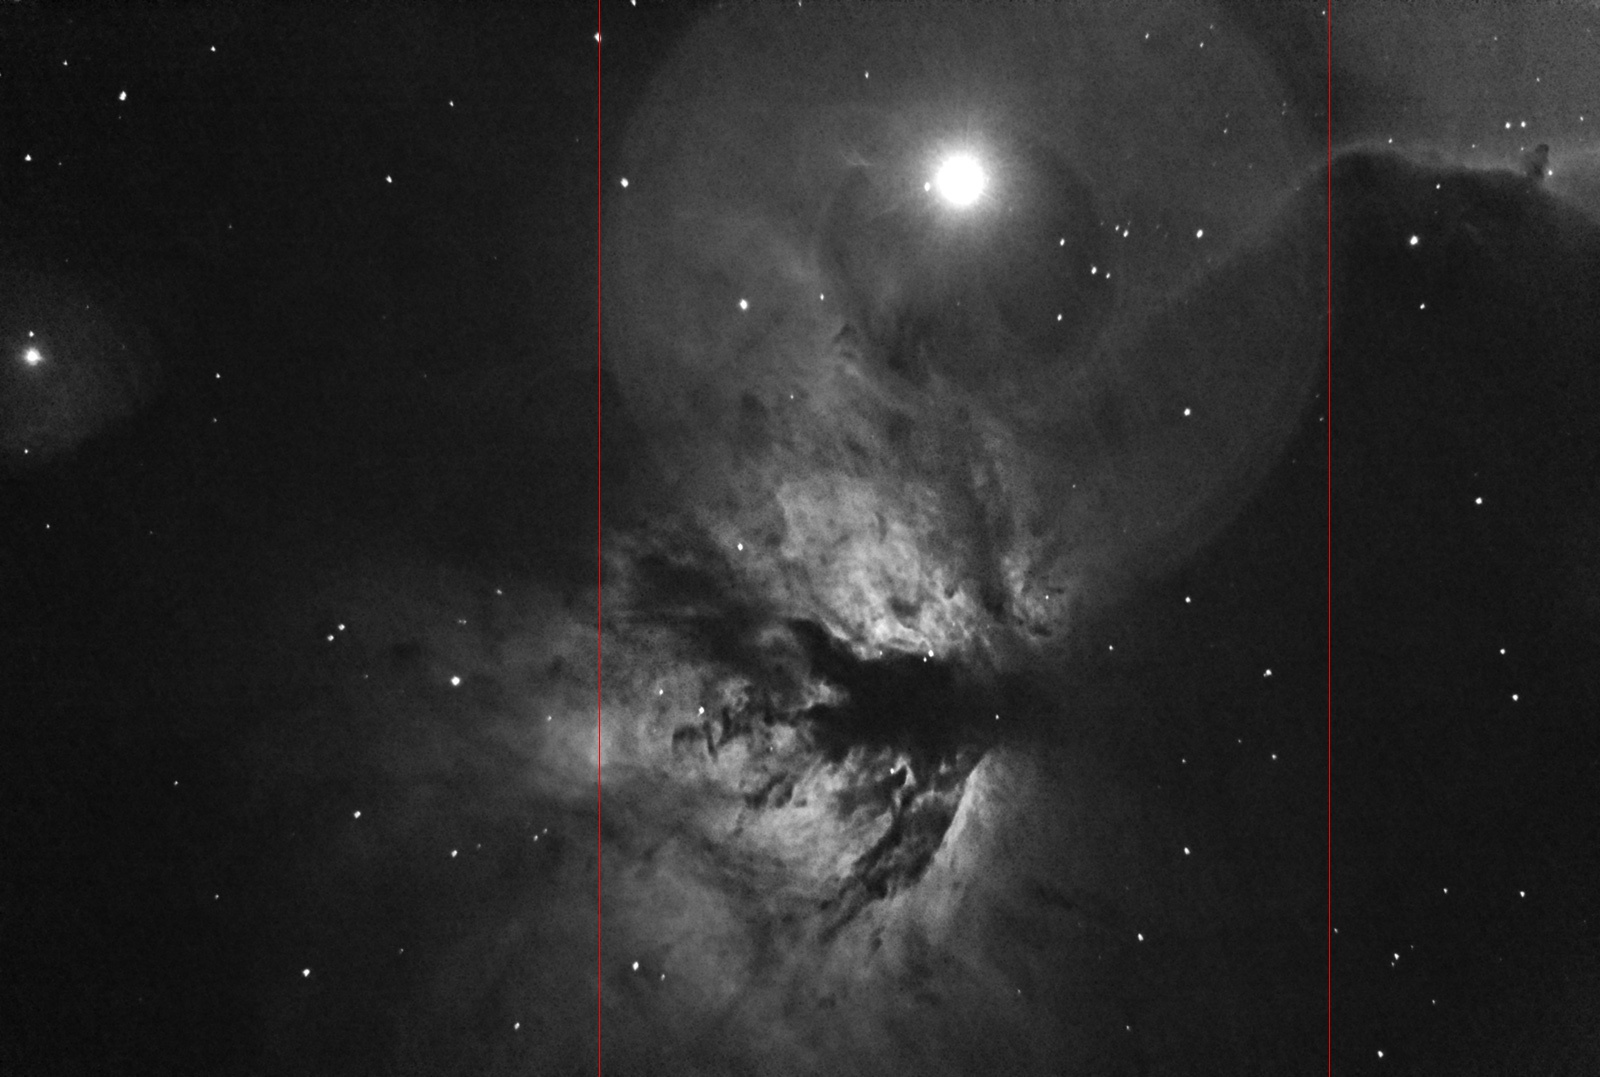
In this example it is difficult to measure the vertical extents for the larger circles, so instead I guess at the center of each circle (the blue lines in Figure 3). I’ve marked all the approximate edges of the circles (green for the vertical). You need to keeping track of each of the x and y location to be used later. It helps to organized the data by circle. You can change the colors by switching the 0/1 values in the R/K, G & B channels equations.
Figure 3 – Many Lines Inserted in Image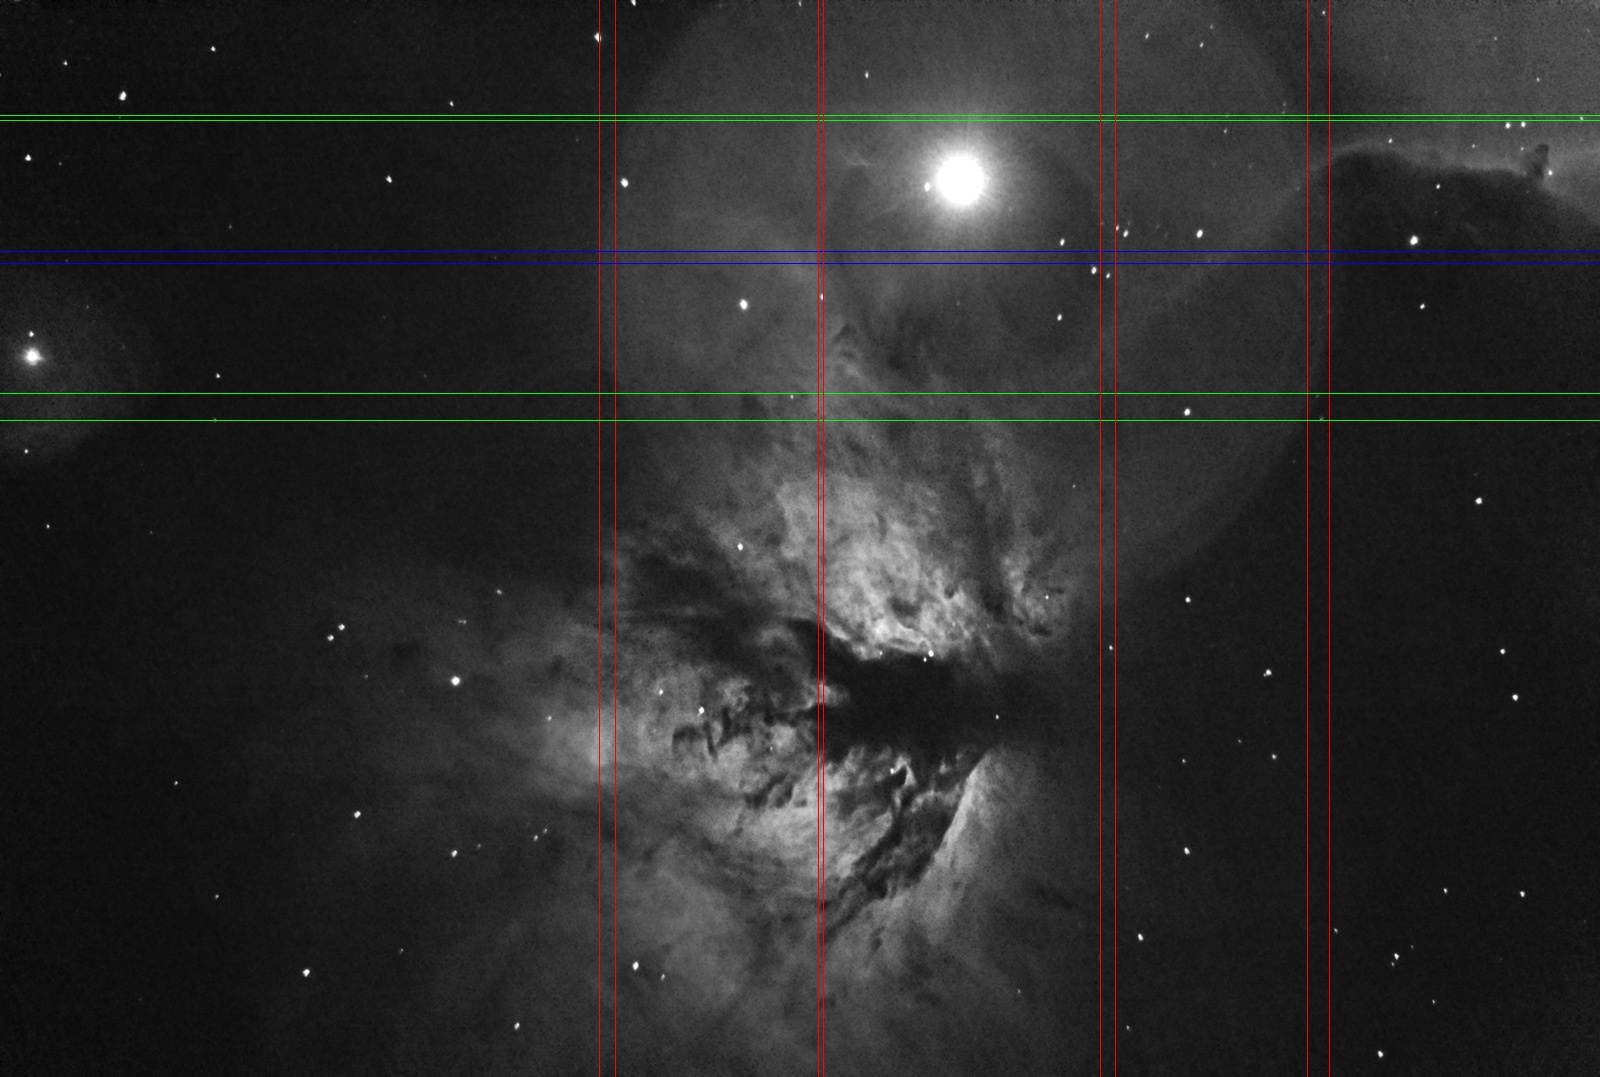
Measure the Circles – Intensities:
Instead of just hovering over each circle and reading the value from the PixInsight status bar, we are going to get a better estimate by including more pixels. This can be done several ways, but I am going to use previews so I have better control over the sampling regions.
Figure 4 – Sampling Locations
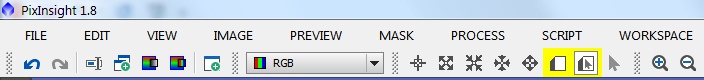
To add a preview to a window click on the highlighted ‘New Preview Window Mode’ (the left of the two icons highlighted in yellow in Figure 5). Next click and drag in the image to create the preview box (see Figure 4). If you don’t like the position or size of a preview you can change it using the second icon which in enables ‘Preview Edit Mode’. Create a preview to sample the values in each circle as well as just outside. Try not to include any stars or nebulosity.
Figure 5 – Preview Controls
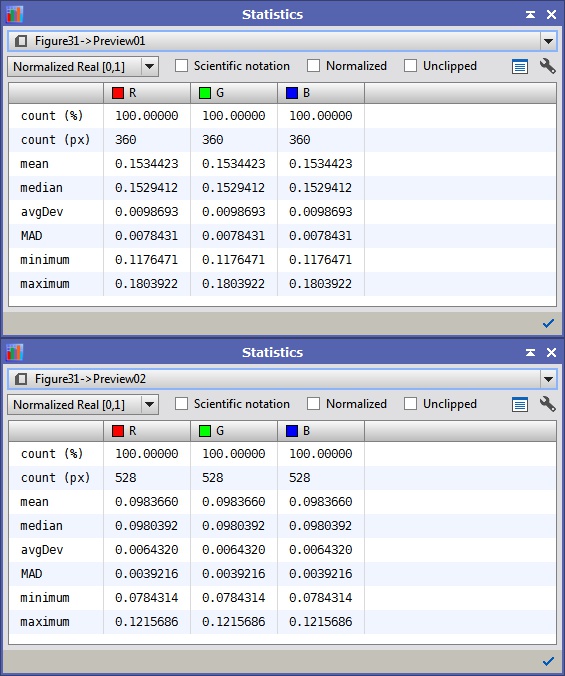
Next we use the Statistics tool to measure the mean (or median if you have some small stars in the preview) of each preview. In Figure 6 Preview01 represents the largest circle and Preview02 the background outside the circles (from Figure 4). We want to know the delta from the background to all the circles. In this case the difference between the means for each preview is 0.0550763. This value will be the intensity value we use for this circle later on, so add it to your data.
Figure 6 – Statistics Read-out
Determine the Center and Radius for Each Circle:
For the circles that you measured the extents of, you can calculate the center as:
(xHigh + xLow)/2
And the radius as:
(xHight – xLow)/2
If you estimated the center, just use that value. Use the same process for the vertical extents. Put the center and radius data with the intensity information to be used later. Putting all the information in a spreadsheet is very helpful since you can have it do some of the math for you.
Create a new Image for the Halo:
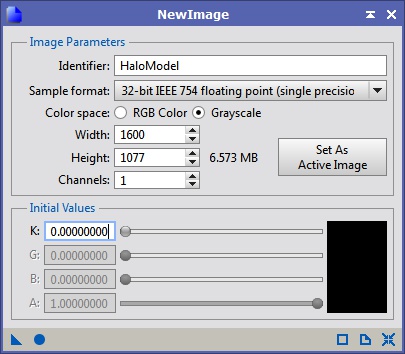
This can be done with the Image->New menu option (See Figure 7). The original image was 1600×1077 so I set the same size here. Initialize it with black: k=0.0 then click the circle icon to create the new image (this is the ‘Global Apply’ button which tells the tool to run without an active view as a reference).
Figure 7 – The NewImage Tool
Using PixelMath to Create the Halo Model:
This next part seems complicated but it really just boils down to simple algebra. The equation for a circle about the origin in a Cartesian coordinate system is:
r^2 = x^2 + y^2 (Equation1)
This can be extended to place the circle about an arbitrary center: (cx, cy)
r^2 = (x-cx)^2 + (y-cy)^2 (Equation2)
We are going to use the center and radius information we measured to see if we are within a particular radius:
r = √((x-cx)^2 + (y-cy)^2) (Equation3)
Figure 8 – Creating a Filled Circle With PixelMath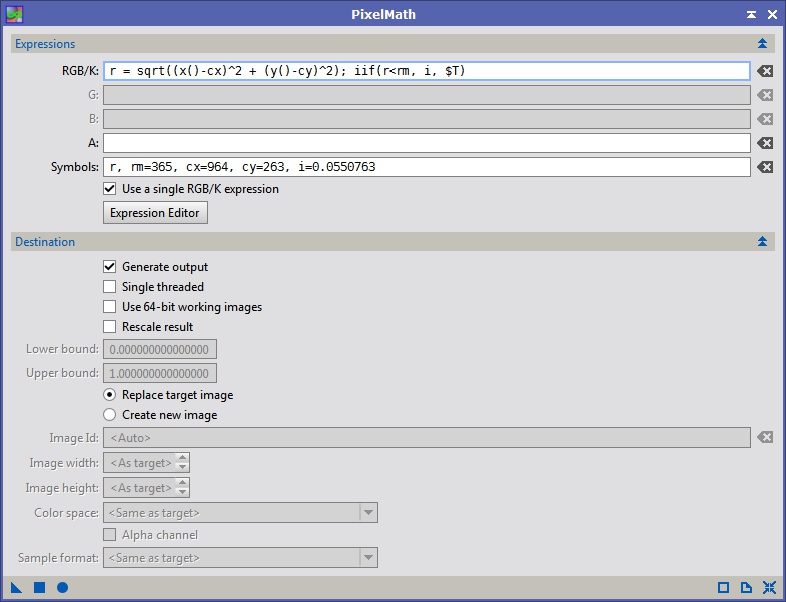
Figure 8 details:
The symbols are essentially variables, you can assign them as a constant in the Symbols field: r is the radius, rm the max radius, cx & cy the center of the circle and i the intensity. The first part of the equation is simply Equation3 above. The second part is an inline-if. It checks to see if the radius from the given location to the defined center is less than the max radius. If it is, the value of ‘i’ is stored at that location, otherwise the existing value is used (which should be black at this point).
Repeat Figure8 for each circle from the largest to the smallest. This keeps you from having to check interior and exterior radii for each circle, since the smaller circle will replace the values there. After the model is complete, do a minor convolution to soften the edges (Figure 9). The final image should look similar to the halo you are trying to remove (Figure 10).
Figure 9 – Convolution (Blurring)
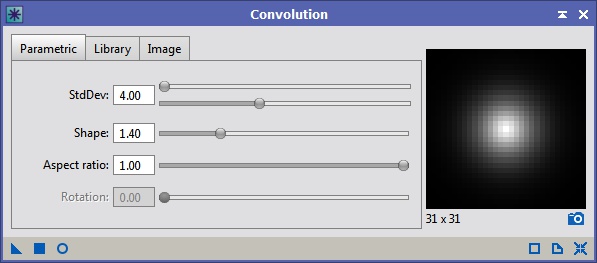
Figure 10 – The Halo Model
Subtract the Model from the Original Image:
Subtracting the HaloModel from the image is easy with PixelMath (see Figure 11). Just drag the triangle icon to the original image and the model will be subtracted. As you can see in Figure 12 below the model is not perfect. Keep refining the model until it looks like there is very little left to cleanup.
Figure 11 – Halo Subtraction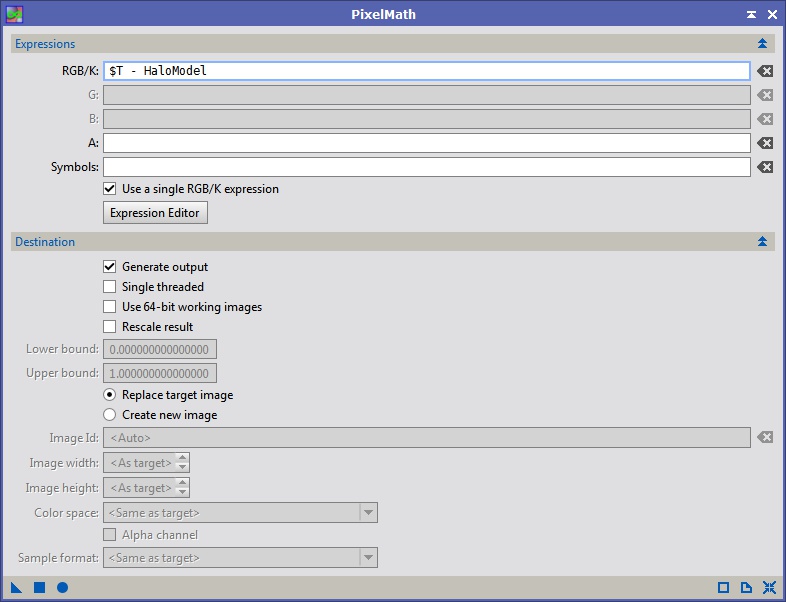
Figure 12 – Halo Subtracted Image
Cleaning up Remaining Artifacts:
After you’ve done all you can with the model we will use the CloneStamp tool. The PixInsight CloneStamp tool is very similar the ones in most other image editing programs. You select a reference location (Ctrl+Left Click) and paint it over the existing data using the mouse. It’s not as fluid as the tools in Photoshop so I find myself doing several single clicks rather than clicking and dragging around. The ‘Opacity’ setting can be used to blend the new data with the existing values making it less obvious that you are pasting data from somewhere else in the image.
Figure 13 – CloneStamp Clean-up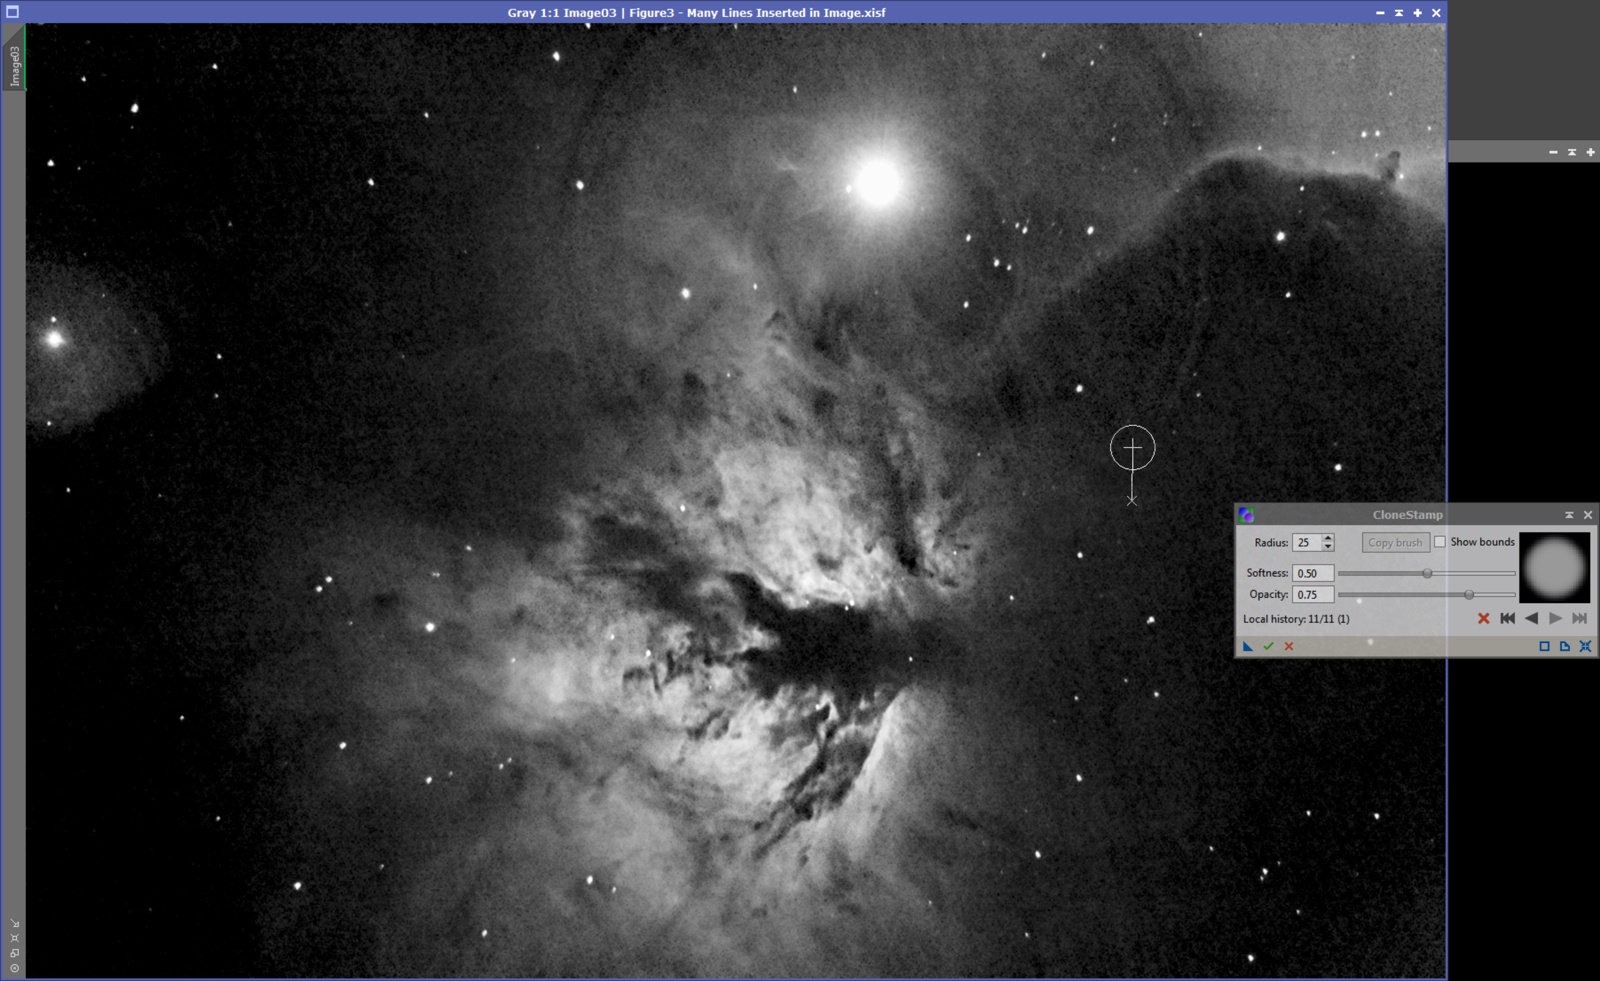
Once you’ve done all this you should have an image that looks something like this: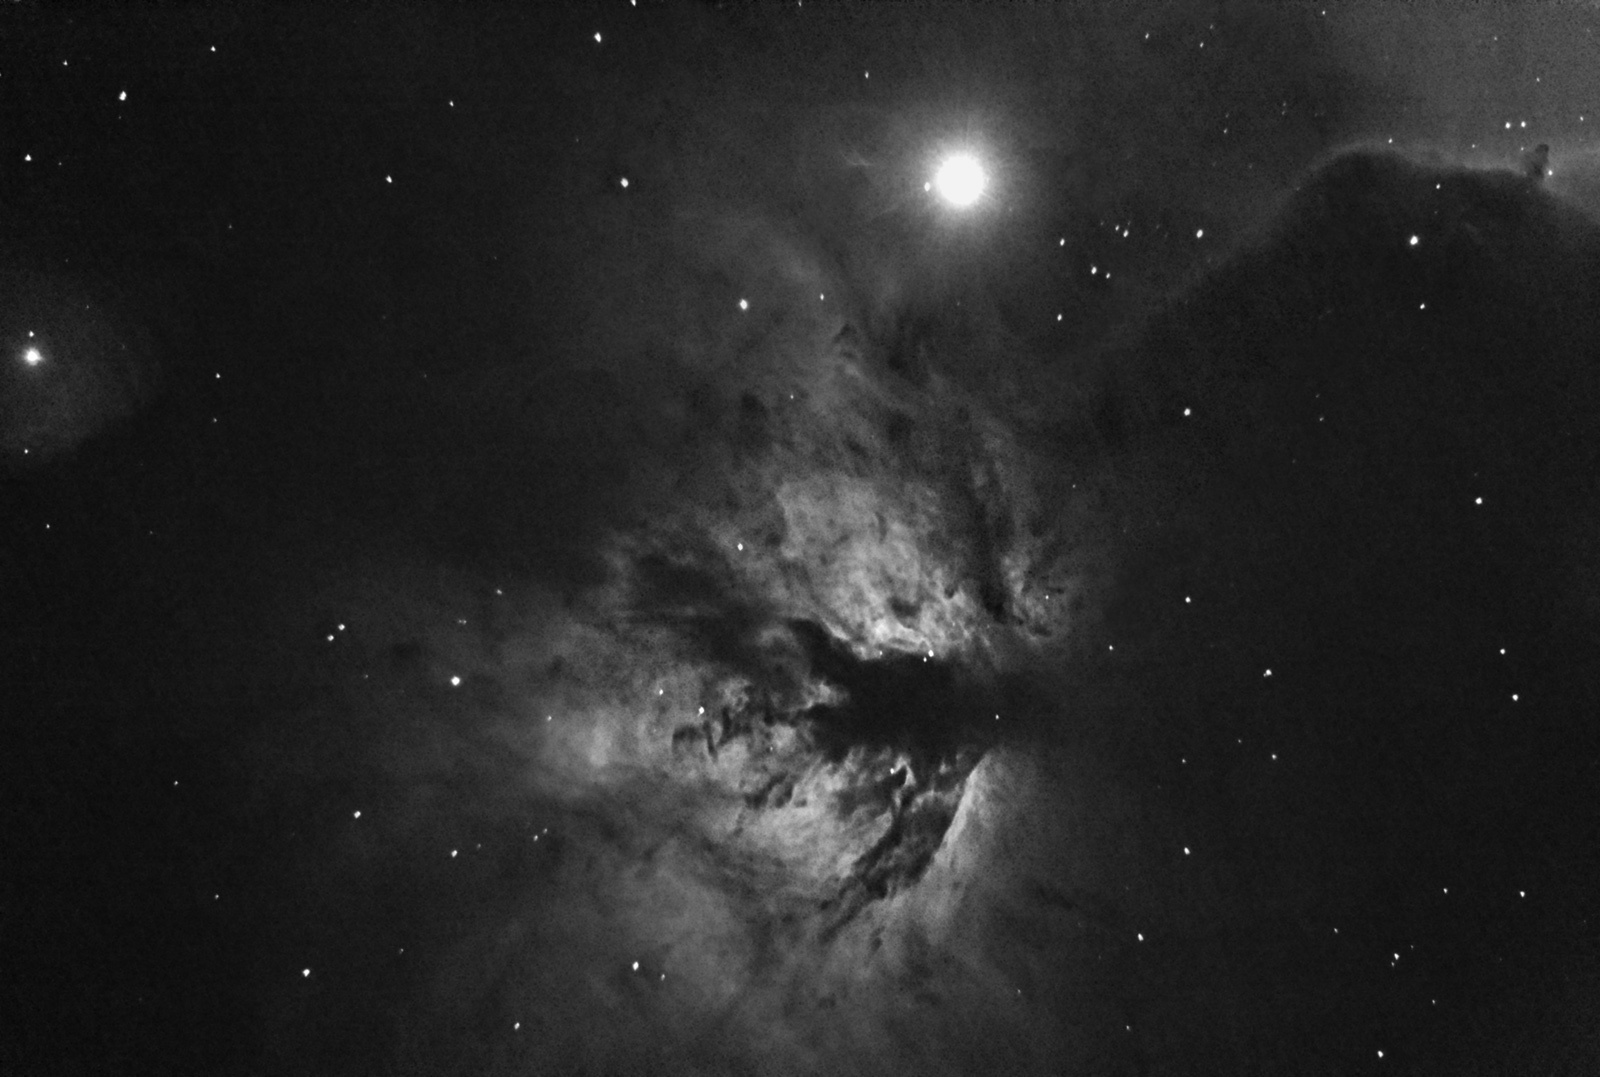
This same type of process can be used to clean up dust donuts, except you will add rather than subtract the model. You can also use PixelMath to estimate vignetting patterns and remove them in a similar way, except you would divide your image by the model. This is useful if you have an image filled with varying nebulosity making DynamicBackgroundExtraction difficult to use.
I also put this together in presentation form, which you can download here.